In developed markets, the U.S. represents 70% of equity capitalization but only about 50% of GDP. This divergence—the U.S.’s status as the “elephant” in the market—has prompted many to ask whether U.S. stocks are overrepresented in global portfolios.
In this piece, we provide allocators a framework to understand the gap in relative market capitalization between the U.S. and other developed markets,[1] and to consider what would need to change for market capitalization to converge with GDP. Our findings suggest that the gap stems mainly from structural and compositional factors, not from U.S. stocks being more expensive than their global industry peers:
- U.S. publicly listed companies generate more earnings per dollar of GDP than developed market peers, which explains nearly two-thirds (64%) of the gap. Our analysis suggests that this likely reflects a larger share of the U.S.’s economic activity being driven by publicly listed companies, not corporate profits representing a greater proportion of GDP.
- The remaining 36% is attributable to U.S. equities trading at a higher aggregate multiple. However, half of that differential (18% of the total) simply reflects industry composition: U.S. indexes comprise higher-multiple industries in greater proportion.
In other words, less than one-fifth (the remaining 17%) of the gap reflects disparity in same-industry valuations.
Market-Cap-to-GDP Gap
To evaluate whether U.S. equities are overrepresented in global portfolios, we benchmark regional equity market size against GDP. We use GDP as an intuitive proxy for economic activity but recognize there are limitations to this approach. Most notably, GDP is a flow (output accumulated over a year), while market capitalization is a stock (a single value at a point in time). To help address this, we look at relative—rather than outright—levels across regions and time.
The figures below decompose developed market equity capitalization (Figure 1) and GDP (Figure 2) by region. The U.S. share of both has grown, but its share of market capitalization has risen faster.
Figure 1:Share of Developed Market Equity Capitalization12/31/1980 – 12/31/2025
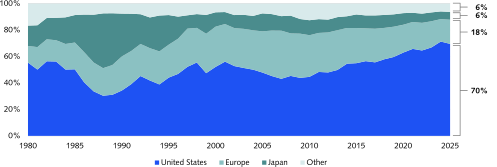
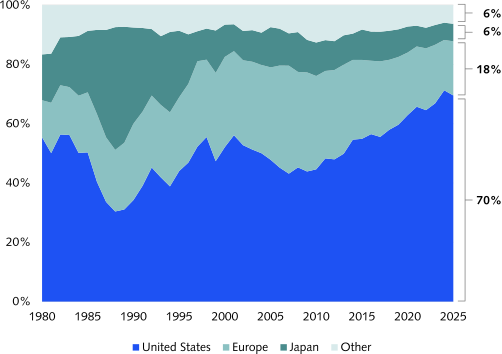
Sources: the D. E. Shaw group; World Federation of Exchanges; Depository Trust & Clearing Corporation; Haver Analytics; Intercontinental Exchange; MSCI; Reuters. Based on data availability, World Federation of Exchanges data is used for the period covering 1980 to 2004, and MSCI data is used for the period covering 2005 to 2025.
Figure 2:Share of Developed Market GDP12/31/1980 – 12/31/2025
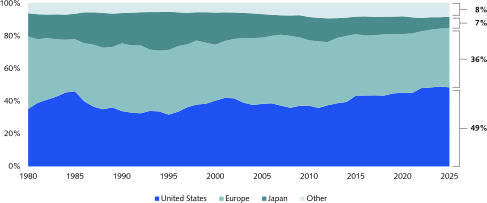
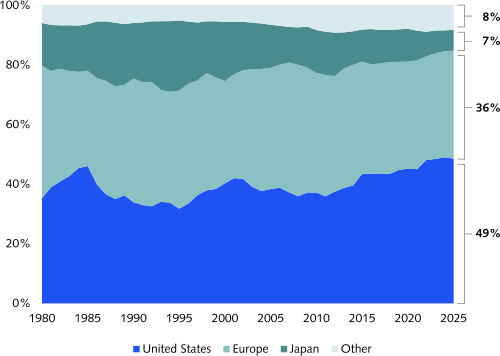
Sources: the D. E. Shaw group; Haver Analytics.
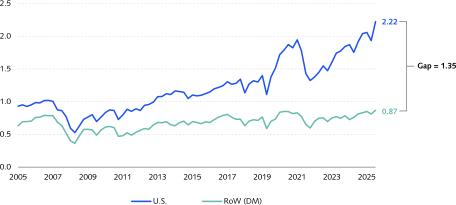
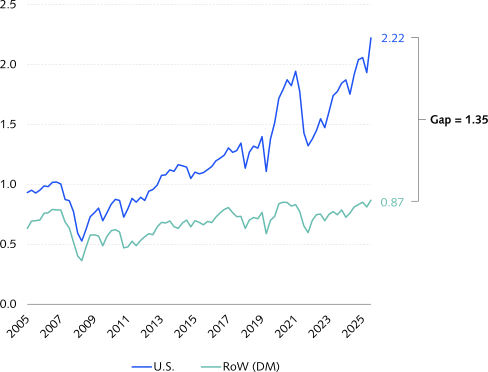
Putting these trends together, Figure 3 plots the ratio of market capitalization to GDP for the U.S. and other developed markets over the past two decades. As of June 30, 2026, the U.S. market-cap-to-GDP ratio was more than double that of other developed markets (2.22 vs. 0.87). Understanding this gap is the focus of our analysis.
Figure 3:Market-Cap-to-GDP Ratio: U.S. vs. RoW (DM)12/30/2005 – 6/30/2026
Sources: the D. E. Shaw group; Depository Trust & Clearing Corporation; Haver Analytics; Intercontinental Exchange; MSCI; Reuters. Applicable data used with permission of Bloomberg L.P.
Breaking It Down
Market-cap-to-GDP can be represented as earnings-to-GDP (E/GDP) multiplied by aggregate price-to-earnings (P/E).
Market capGDP = EGDP × PE
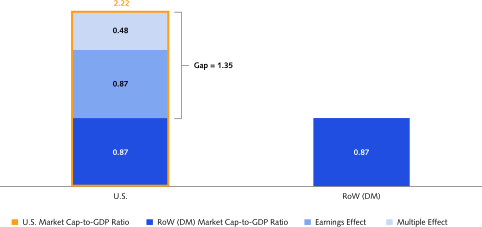
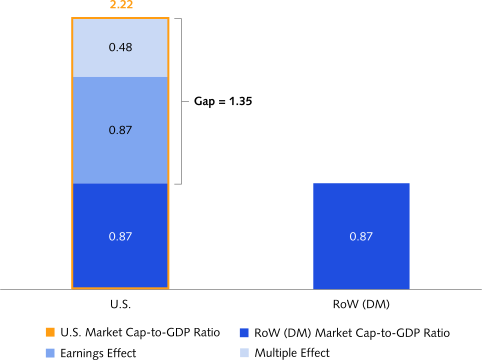
Throughout, we use this identity to explain why the U.S. market cap share is disproportionately large. As Figure 4 shows, the gap in market-cap-to-GDP between the U.S. and the rest of developed markets can be split into two drivers: U.S. public companies generating more earnings per dollar of GDP (the earnings effect) and those earnings being assigned a higher multiple (the multiple effect). The earnings effect accounts for roughly two-thirds of the gap (0.87 out of 1.35) and the multiple effect for roughly one-third (0.48 out of 1.35).
Figure 4:Market-Cap-to-GDP Ratio Decomposition: U.S. vs. RoW (DM)As of 6/30/2026
Sources: the D. E. Shaw group; Depository Trust & Clearing Corporation; Haver Analytics; Intercontinental Exchange; MSCI; Reuters. Applicable data used with permission of Bloomberg L.P.
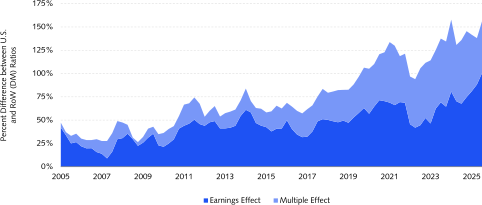
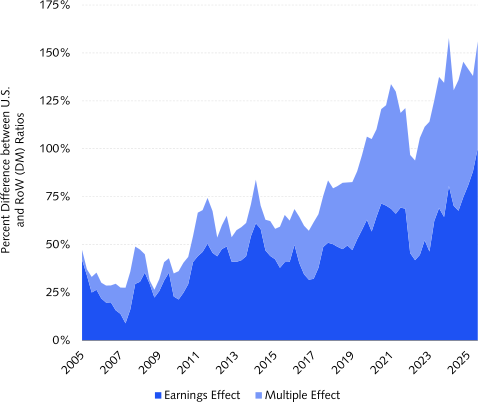
We can also see how these two effects have contributed to the gap widening over time. Figure 5 plots the percentage by which the U.S. market-cap-to-GDP ratio exceeds that of other developed markets, split between the earnings effect (E/GDP) and the multiple effect (P/E).[2]
Figure 5:Market-Cap-to-GDP Ratio Gap: U.S. vs. RoW (DM)12/30/2005 – 6/30/2026
Sources: the D. E. Shaw group; Depository Trust & Clearing Corporation; Haver Analytics; Intercontinental Exchange; MSCI; Reuters. Applicable data used with permission of Bloomberg L.P.
The U.S. market-cap-to-GDP ratio has exceeded that of the rest of developed markets for at least two decades, and that difference has grown significantly over the past ten years. Over time, however, the relative contribution of each driver has shifted. The earnings effect was the dominant driver of U.S. outperformance from 2005 to 2016; since 2022, the earnings and multiple effects have been approximately equal.
The Earnings Effect: A Listing Story?
At first glance, the fact that U.S. public companies generate more earnings per dollar of GDP might seem to reflect how income is divided between corporations and the rest of the economy (i.e., total corporate profits as a percentage of GDP). However, because earnings-to-GDP includes only the profits of listed companies, having a higher proportion of publicly traded companies in one country will cause its earnings-to-GDP to be higher, all else equal.
This is demonstrated in the equation below:
EGDP = Publicly listed profit, ETotal corporate profit × Total corporate profitGDP
Comparing total corporate profits across countries is difficult given differences in how the data is prepared. However, as an illustrative exercise, we can compute non-financial gross operating surplus—the profit that non-financial businesses earn from producing goods and services—as a percentage of GDP for both the U.S. and Europe. (We selected Europe because it represents the majority of non-U.S. developed market earnings, and we focus on non-financial data because accounting practices for financials aren’t as directly comparable across countries.) Because gross operating surplus captures the profits of both public and private businesses, it can be used as a proxy for an economy’s overall corporate profitability, the final term in our equation.
The table below shows that the U.S.’s operating surplus as a percentage of GDP is smaller than Europe’s, suggesting that U.S. businesses as a whole are no more profitable relative to GDP. This suggests that the U.S.’s higher earnings-to-GDP ratio is driven primarily by its higher share of publicly listed companies.[3]
Table 1:Operating Surplus as a Percentage of GDP1/1/2025 – 12/31/2025
| United States | Europe (EU-27) [4] | |
|---|---|---|
| Gross operating surplus ($bn) | 8,612.8 | 6,349.5 |
| Nominal GDP ($bn) | 30,762.1 | 21,247.8 |
| Gross operating surplus (% of GDP) | 28.0% | 29.9% |
Sources: the D. E. Shaw group; Haver Analytics.
The Multiple Effect: A Composition Story?
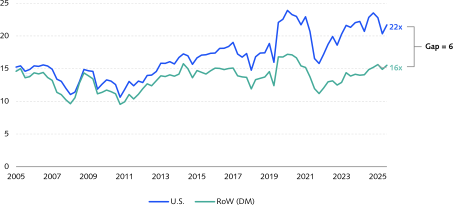
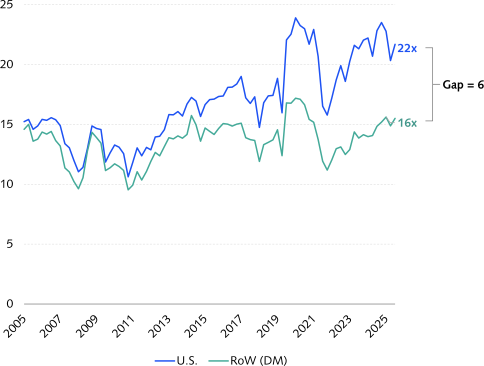
Market participants have noted the U.S. equity market’s relatively high headline multiple. Figure 6 shows that, as recently as 2019, the aggregate multiples of the U.S. and the rest of developed markets were similar at around 15x, while now they’re 22x and 16x, respectively.
Figure 6:Price-to-Forward Earnings Ratio: U.S. vs. RoW (DM)12/30/2005 – 6/30/2026
Sources: the D. E. Shaw group; Depository Trust & Clearing Corporation; Intercontinental Exchange; MSCI; Reuters; S&P Global Market Intelligence. Applicable data used with permission of Bloomberg L.P.
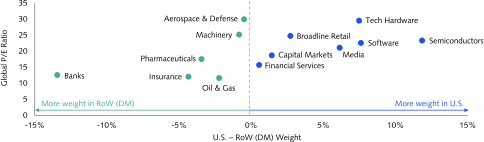
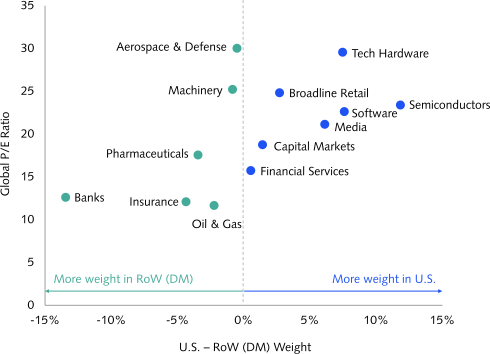
However, these headline multiples don’t tell the whole story. Different markets have different industry blends, and the U.S. market is overweight high-multiple industries relative to other developed markets, as Figure 7 illustrates. Even if every industry were valued identically across regions, the U.S. market would exhibit a higher overall multiple simply because of its industry mix.
Figure 7:Industry Groups: Global Price-to-Forward Earnings Multiples vs. Relative U.S. Market Capitalization WeightFor industry groups representing ≥2% of global market capitalizationAs of 6/30/2026
Sources: the D. E. Shaw group; Depository Trust & Clearing Corporation; Intercontinental Exchange; MSCI; Reuters; S&P Global Market Intelligence. Applicable data used with permission of Bloomberg L.P. The industry groups shown reflect S&P GICS data. All data reflected above are for illustrative purposes only.
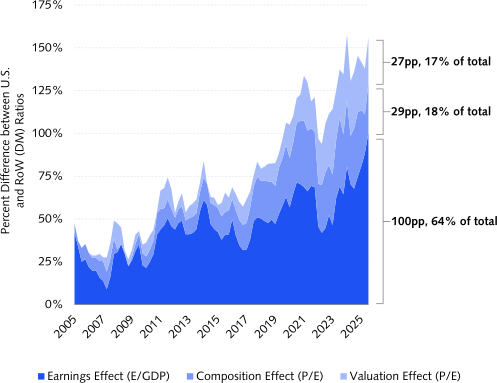
Recall that the multiple effect, shown in Figure 4, accounts for about one-third of the gap (36%) in market-cap-to-GDP ratio between the U.S. and other developed markets. Breaking that down further, we estimate that half of the multiple effect (18% of the total gap) stems from the U.S. market being overweight high-multiple industries: the composition effect. This result holds even if “mega cap” stocks are excluded.
That leaves less than one-fifth (17%) of the total gap attributable to U.S. stocks trading at a premium compared to their industry peers—the valuation effect—the most like-for-like expression of a U.S. valuation premium.[5]
Conclusion
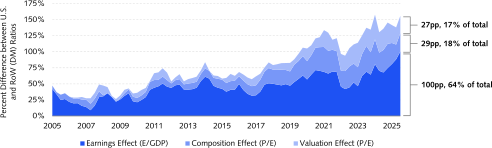
Figure 8 shows that the earnings, composition, and valuation effects have each varied, but generally grown, over time.
Figure 8:Decomposition Over Time: Market-Cap-to-GDP Ratio Gap12/30/2005 – 6/30/2026
Sources: the D. E. Shaw group; Depository Trust & Clearing Corporation; Haver Analytics; Intercontinental Exchange; MSCI; Reuters; S&P Global Market Intelligence. Applicable data used with permission of Bloomberg L.P.
What would need to happen for the U.S. market-cap-to-GDP ratio to converge toward that of other developed markets? Our decomposition points to three potential drivers:
- Earnings effect: U.S. public earnings intensity could approach that of other developed markets, either via less U.S. economic activity being driven by publicly listed companies or by U.S. public companies becoming less profitable than peers abroad.
- Multiple effect:
- Composition effect: industries with currently high multiples could underperform or industry leadership could migrate elsewhere.
- Valuation effect: the U.S. P/E ratio could converge with that of other developed markets within similar industries.
Even a full convergence of the valuation effect would leave the U.S. at roughly 67% of developed market capitalization, a modest decrease from its current 70% share. For now, the U.S.’s elephantine weight in global benchmarks may be better understood as a structural feature than a valuation anomaly: one consideration (among many) for allocators deciding whether to actively under- or overweight U.S. equities in a global portfolio.
[1] Throughout this piece, we define “other developed markets,” “rest of developed markets,” and “RoW (DM)” as the constituents of the MSCI World ex USA Index. Certain countries are excluded due to limited data availability, but we believe these exclusions don’t materially change our findings.
[2] To be precise, this figure decomposes the log difference in market-cap-to-GDP ratios as:
log[(Market cap/GDP)U.S.] − log[(Market cap/GDP)RoW] = Δlog(Market cap/E) + Δlog(E/GDP)
where ∆ denotes the difference between the U.S. and RoW (DM). We call the first term the multiple effect and the second the earnings effect.
[3] We also examined whether differences in cross-border revenue exposure could account for the gap. They do not appear to; if anything, U.S. public company revenue is somewhat less foreign-sourced than that of other developed markets.
[4] This portion of the analysis uses data from all 27 EU countries and excludes the UK. Elsewhere in our analysis, Europe refers to the UK and all other European constituents of the MSCI World ex USA Index (excluding a small subset of countries due to limited data availability).
[5] While we won’t attempt to justify U.S. stocks’ intra-industry valuation premium, that observation on its own does not necessarily mean U.S. stocks are overvalued. There are a number of confounding compositional and fundamental effects that might explain that valuation gap (e.g., imperfect industry classifications or differences in regulatory environments).


The Global Industry Classification Standard (“GICS”) was developed by and is the exclusive property and a service mark of MSCI Inc. (“MSCI”) and S&P Global Market Intelligence (“S&P”) and is licensed for use by D. E. Shaw & Co., L.P. Neither MSCI, S&P, nor any other party involved in making or compiling the GICS or any GICS classifications makes any express or implied warranties or representations with respect to such standard or classification (or the results to be obtained by the use thereof), and all such parties hereby expressly disclaim all warranties of originality, accuracy, completeness, merchantability and fitness for a particular purpose with respect to any of such standard or classification. Without limiting any of the foregoing, in no event shall MSCI, S&P, any of their affiliates or any third party involved in making or compiling the GICS or any GICS classifications have any liability for any direct, indirect, special, punitive, consequential or any other damages (including lost profits) even if notified of the possibility of such damages.
Certain data derived, in modified form, from: World Federation of Exchanges (WFE), via World Bank World Development Indicators — Market Capitalization of Listed Domestic Companies (CM.MKT.LCAP.CD). 103 economies, 1975–2025, annual. https://data360.worldbank.org/en/indicator/WB_WDI_CM_MKT_LCAP_CD. Licensed under CC BY 4.0.
THIS DOCUMENT IS PROVIDED TO YOU FOR INFORMATIONAL PURPOSES ONLY AND DOES NOT CONSTITUTE INVESTMENT ADVICE OR AN OFFER TO SELL (OR THE SOLICITATION OF AN OFFER TO BUY) ANY SECURITY, INVESTMENT PRODUCT, OR SERVICE.
THE VIEWS EXPRESSED IN THIS DOCUMENT ARE SOLELY THOSE OF THE D. E. SHAW GROUP AS OF THE DATE OF THIS DOCUMENT, ARE SUBJECT TO CHANGE WITHOUT NOTICE, AND MAY NOT REFLECT THE CRITERIA EMPLOYED BY ANY PERSON OR ENTITY IN THE D. E. SHAW GROUP TO EVALUATE INVESTMENTS OR INVESTMENT STRATEGIES. SIMILARLY, THE INFORMATION CONTAINED IN THIS DOCUMENT IS PRESENTED SOLELY WITH RESPECT TO THE DATE OF THIS DOCUMENT (UNLESS OTHERWISE INDICATED) AND MAY BE CHANGED OR UPDATED AT ANY TIME WITHOUT NOTICE TO ANY OF THE RECIPIENTS OF THIS DOCUMENT. THE INFORMATION CONTAINED IN THIS DOCUMENT HAS BEEN DEVELOPED BY THE D. E. SHAW GROUP AND/OR OBTAINED FROM SOURCES BELIEVED TO BE RELIABLE; HOWEVER, THE D. E. SHAW GROUP DOES NOT GUARANTEE THE ACCURACY, ADEQUACY, OR COMPLETENESS OF SUCH INFORMATION. FURTHER, THIS DOCUMENT CONTAINS PROJECTIONS AND OTHER FORWARD-LOOKING STATEMENTS REGARDING FUTURE EVENTS, TARGETS, OR EXPECTATIONS. SUCH STATEMENTS ARE BASED IN PART ON CURRENT MARKET CONDITIONS, WHICH WILL FLUCTUATE AND MAY BE SUPERSEDED BY SUBSEQUENT MARKET EVENTS OR OTHER FACTORS. HISTORICAL MARKET TRENDS ARE NOT RELIABLE INDICATORS OF FUTURE MARKET BEHAVIOR OR THE FUTURE PERFORMANCE OF ANY PARTICULAR INVESTMENT AND SHOULD NOT BE RELIED UPON AS SUCH.
MORE GENERALLY, NO ASSURANCES CAN BE GIVEN THAT ANY AIMS, ASSUMPTIONS, EXPECTATIONS, AND/OR OBJECTIVES DESCRIBED IN THIS DOCUMENT WILL BE REALIZED. NONE OF THE ENTITIES IN THE D. E. SHAW GROUP; NOR ANY OF THEIR RESPECTIVE AFFILIATES; NOR ANY SHAREHOLDERS, PARTNERS, MEMBERS, MANAGERS, DIRECTORS, PRINCIPALS, PERSONNEL, TRUSTEES, OR AGENTS OF ANY OF THE FOREGOING SHALL BE LIABLE FOR ANY ERRORS (AS A RESULT OF NEGLIGENCE OR OTHERWISE, TO THE FULLEST EXTENT PERMITTED BY LAW IN THE ABSENCE OF FRAUD) IN THE PRODUCTION OR CONTENTS OF THIS DOCUMENT, OR FOR THE CONSEQUENCES OF RELYING ON SUCH CONTENTS.
NEITHER THIS DOCUMENT NOR ANY PART OF THIS DOCUMENT MAY BE REPRODUCED OR DISTRIBUTED WITHOUT THE PRIOR WRITTEN AUTHORIZATION OF THE D. E. SHAW GROUP.
COPYRIGHT © 2026 D. E. SHAW & CO., L.P. ALL RIGHTS RESERVED.